
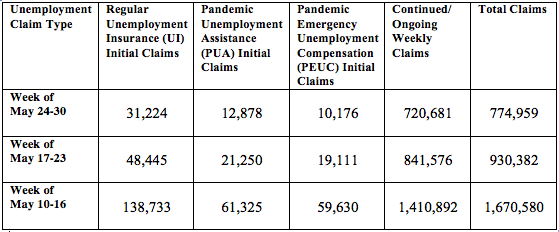
OLYMPIA – During the week of May 24-30, there were 31,224 initial regular unemployment claims (down 36% from the prior week) and 774,959 total claims for all unemployment benefit categories (a decrease of 155,423) filed by Washingtonians, according to the Employment Security Department (ESD). ESD believes the continued decrease is due to a variety of reasons including fraud prevention measures and more people going back to work with the reopening of some industry sectors and regions over the past three weeks.
ESD paid out over $514.7 million for 400,352 individual claims.
Since the week ending March 7 when COVID-19 job losses began:
- A total of 2,045,863 initial claims have been filed during the pandemic (1,280,711 regular unemployment insurance, 409,566 PUA and 355,523 PEUC)
- A total of 1,152,516 distinct individuals have filed for unemployment benefits
- ESD has paid out over $4.9 billion in benefits
- 826,123 individuals who have filed an initial claim have been paid
“The dramatic decline in initial claims this week is a strong signal that the additional steps we are taking to address imposter fraud are working. We’ve already recovered and stopped the payments of hundreds of millions of dollars in fraudulent claims in the past two weeks, and we will continue to reclaim every dollar we can,” said ESD Commissioner Suzi LeVine. ”Our priorities from day one of this crisis have been to get benefits out to Washingtonians who need them quickly and expand eligibility so those impacted can get the help they need, and we are continuing to ramp up our staffing to work through the large numbers of applicants and adjudications. We know every day matters for people awaiting their benefits. We are committed to processing those claims as quickly as possible.”
Below is a thirteen-week summary of statewide initial claims filed since the start of the COVID-19 crisis:
Weekly data breakdown
By industry
Industry sectors experiencing the highest number of initial claims during May 24-30 were:
- Health care and social assistance: 3,614 initial regular claims, down 1,699 (32 percent) from the previous week
- Accommodation and food services: 3,065 initial regular claims, down 700 (19 percent) from previous week
- Retail trade: 2,826 initial regular claims, down 1,410 (33 percent) from previous week
- Construction: 2,437 initial regular claims, down 574 (19 percent) from the previous week
- Manufacturing: 2,288 regular initial claims, down 1,373 (38 percent) from the previous week
By occupation
- Management occupations: 4,383 regular initial claims, down 7,115 (62 percent) from the previous week
- Food preparation and serving: 3,169 regular initial claims, down 585 (16 percent) from previous week
- Office and administrative support: 2,804 regular initial claims, down 885 (24 percent) from previous week
- Construction and extraction occupations: 2,783 regular initial claims, down 459 (14 percent) from the previous week
- Transportation and material moving occupations: 2,343 regular initial claims, down 556 (19 percent) from the previous week
- Sales and related occupations: 2,285 regular initial claims, down 1,027 (31 percent) from the previous week
By county
King County, the most populous in the state saw initial regular claims decrease from 14,371 to 8,974 during the week of May 24-30, down 38 percent from the week before.
Other counties with the largest number of initial claims during the week were:
- Pierce County: Initial regular claims filed decreased from 6,348 to 4,069 down 36 percent from the week before.
- Snohomish County: Initial regular claims filed decreased from 5,675 to 3,580 down 37 percent from the week before.
- Spokane County: Initial regular claims filed decreased from 2,932 to 1,973 down 39 percent from the week before.
- Clark County: Initial regular claims filed decreased from 2,182 to 1,385 down 37 percent from the week before.
Demographic breakdown
During the week of May 24-30:
- By gender: 51.0 percent (15,938) of the initial regular claims were filed by males while 48.5 percent (15,148) were filed by females
- By age group: 24.9 percent (7,786) of initial regular claims were filed by the 25-34 years old age group, followed by 20.7 percent (6,461) by the 35-44 years old age group and 17.5 percent (5,465) by the 45-54 years old age group.
- By race/ethnicity: 61.0 percent (19,046) of initial regular claims were filed by Caucasians, followed by 7.5 percent (2,352) filed by Asians and 6.4 percent filed by African Americans (2,005).
- By disability status: 2.1 percent (643) of initial regular claims were from individuals identified as having a disability, including 0.1 percent (18) who identified themselves as disabled veterans.
- By veterans status: 4.9 percent (1,544) of initial regular claims were filed by veterans, including 152 initial regular claims from individuals eligible for veterans benefits due to family relations with a veteran
Please see new charts in the Appendix A below. For complete information of weekly initial claims by industry sector and county for the year to date, also check the weekly unemployment initial claims charts compiled by ESD’s Labor Market & Economic Analysis division. For more information about specific counties, contact one of ESD’s regional local economists.